Description
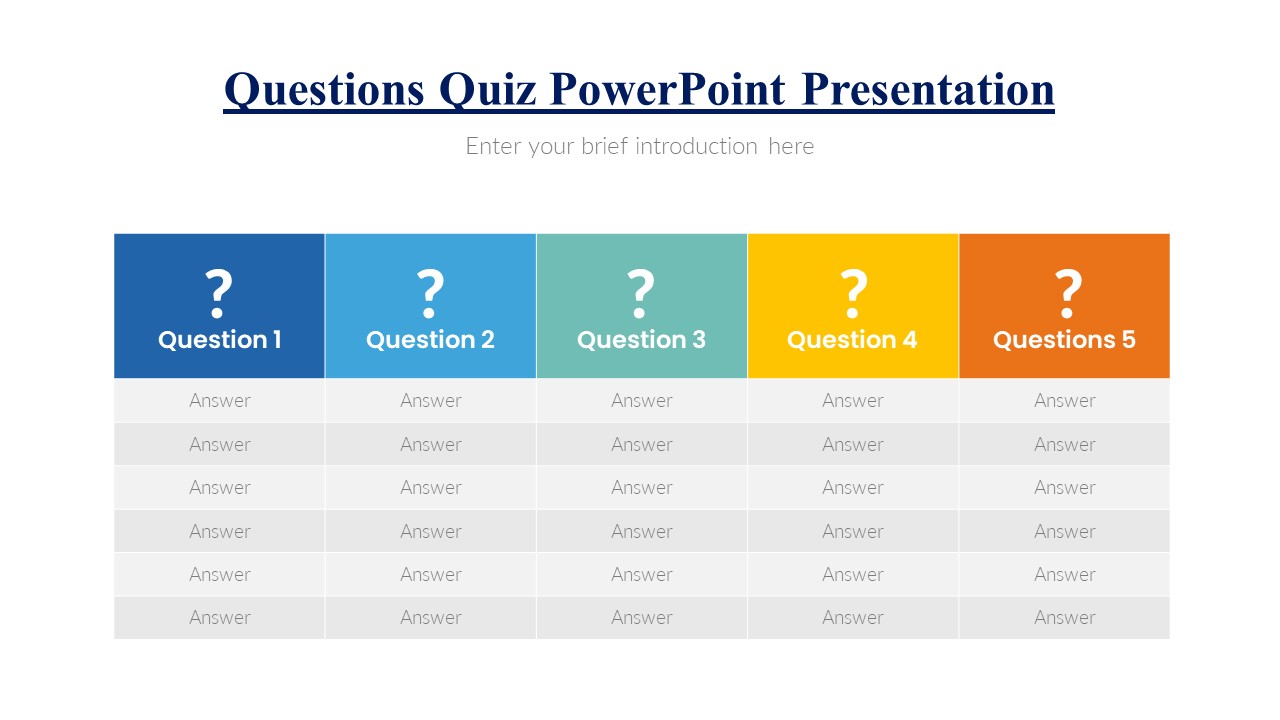
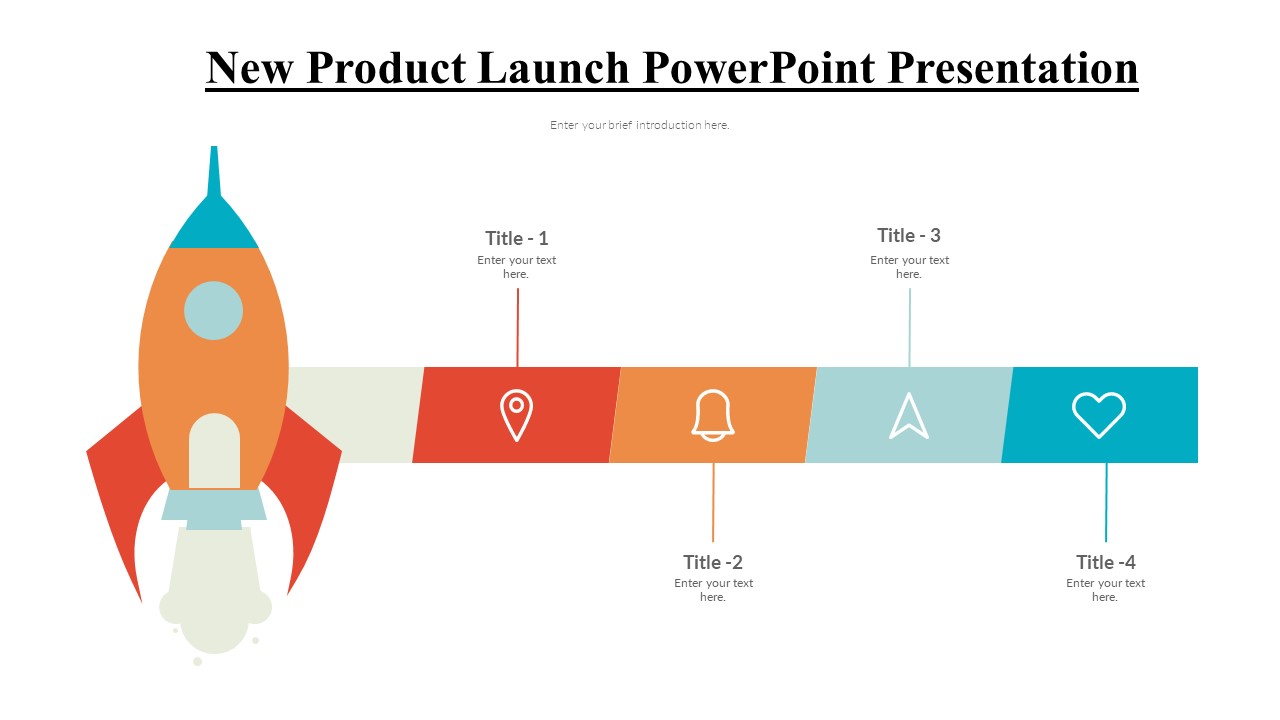
The Progress Chart PowerPoint Presentation is a powerful tool designed to help you visually represent and track progress on various projects, tasks, or goals. Whether you are a project manager, team leader, educator, or business owner, this presentation template can facilitate clear communication and understanding of progress indicators.
With a clean and professional design, the Progress Chart PowerPoint Presentation offers a range of pre-designed slides that can be easily edited to suit your specific needs. You can customize the color scheme, fonts, and layout to match your branding or personal preferences. The charts and graphs included in the template are fully editable, allowing you to input your data and adjust the visual elements to effectively communicate your progress.
Key Features:
– Fully editable charts and graphs: Easily input your data and customize the visual elements to create impactful progress charts.
– Multiple slide layouts: Choose from a variety of slide designs to best present your progress information.
– Customizable color scheme and fonts: Tailor the presentation to match your branding or personal style.
– Easy to use and navigate: The template is user-friendly and can be quickly edited even by those with limited PowerPoint experience.
– Versatile application: Suitable for a wide range of industries and purposes, from project management to educational presentations.
With the Progress Chart PowerPoint Presentation, you can showcase your progress, track key metrics, and effectively communicate your goals and achievements. Whether you are presenting to a small team or a large audience, this template will help you convey complex information in a clear and visually appealing way.


There are no reviews yet.