

Description
The Visualizing Risk Management KPIs PowerPoint Presentation is a comprehensive and professional tool designed to help organizations effectively track and monitor key performance indicators related to risk management. This presentation template offers a visually appealing and easy-to-understand way to showcase important KPIs, making it ideal for board meetings, executive presentations, and risk management training sessions.
With a clean and modern design, this PowerPoint presentation includes a variety of slide layouts that are fully customizable to suit your specific needs. From defining risk management KPIs to analyzing data trends and presenting insights, this template covers all aspects of visualizing risk management KPIs in a clear and concise manner.
Features:
1. Fully Editable Slides: Easily customize the content, colors, fonts, and images to match your brand and preferences.
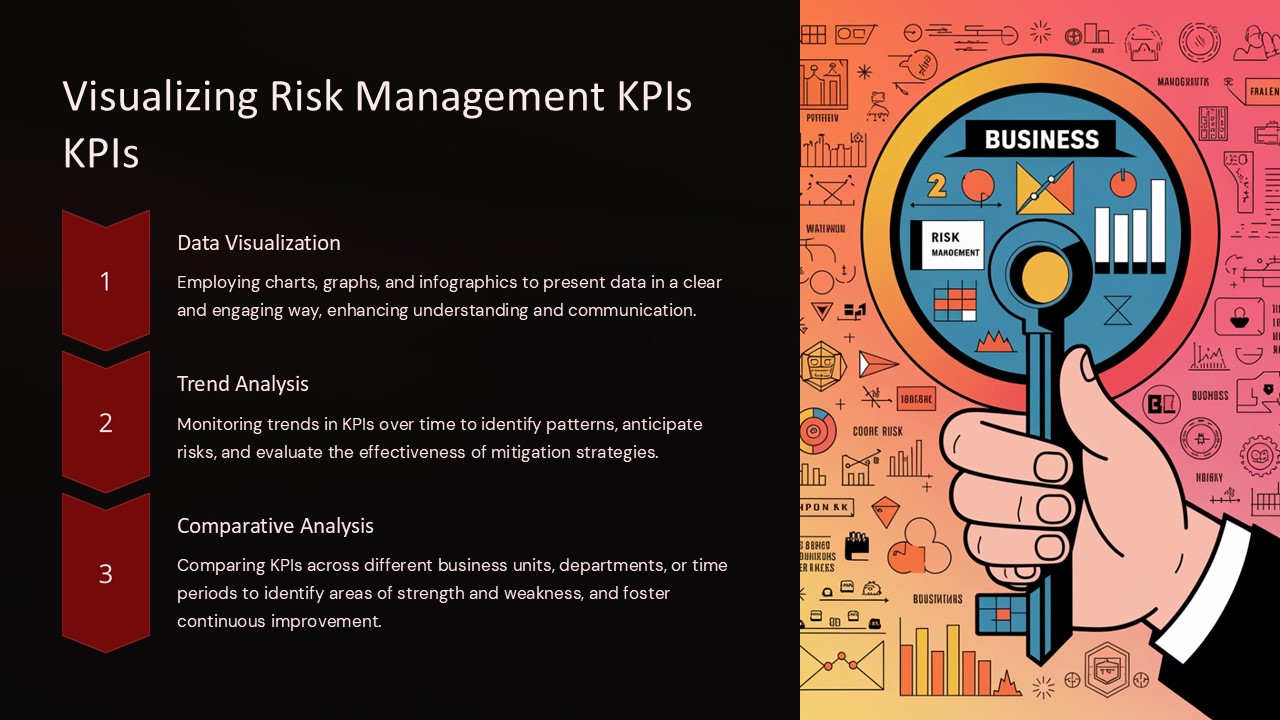
2. Data Visualization Tools: Use charts, graphs, and infographics to visually represent key risk management KPIs and trends.
3. Comprehensive Coverage: Includes slides for defining KPIs, tracking performance, analyzing data, and making informed decisions.
4. Easy-to-Use Layouts: Choose from a variety of slide layouts that are designed to help you effectively communicate complex information.
5. Professional Design: Impress your audience with a sleek and modern presentation that conveys professionalism and expertise in risk management.
Overall, the Visualizing Risk Management KPIs PowerPoint Presentation is a valuable resource for organizations looking to improve their risk management practices and make strategic decisions based on data-driven insights. Whether you are an executive, risk manager, or consultant, this template will help you effectively communicate key KPIs and drive organizational success.


There are no reviews yet.