

Description
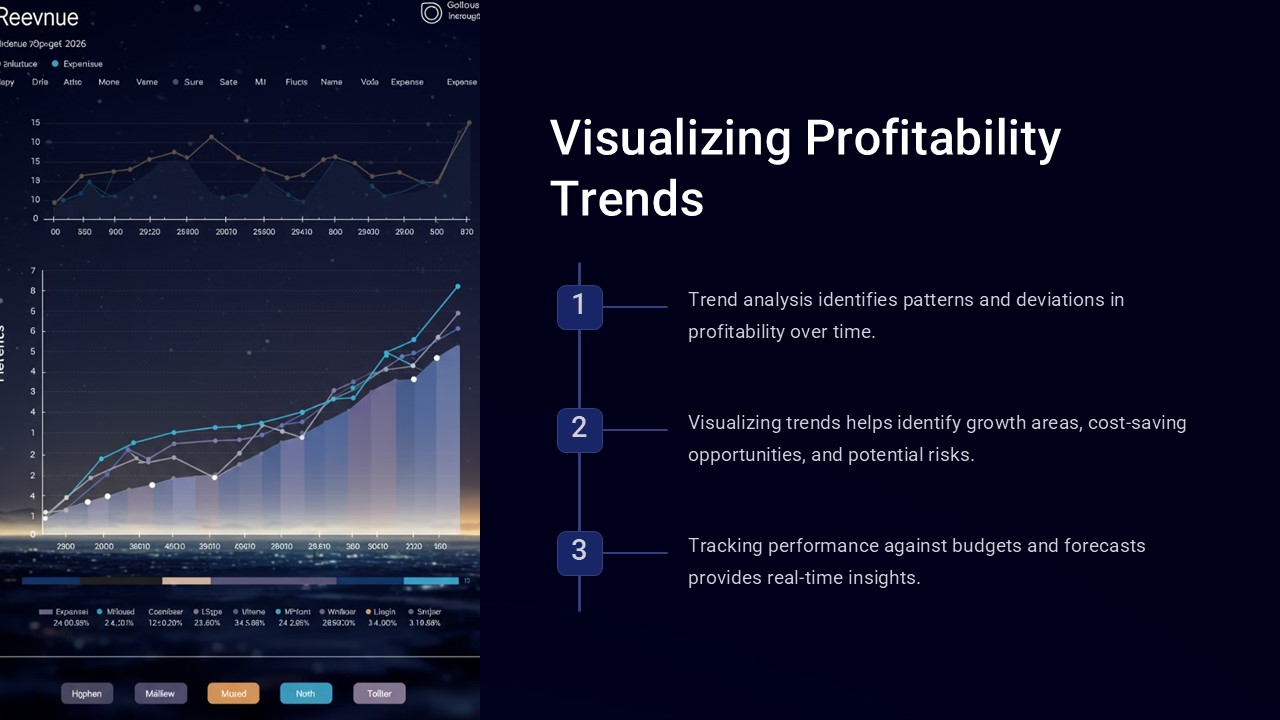
The Visualizing Profitability Trends PowerPoint Presentation is the perfect tool for businesses looking to analyze and showcase their financial performance over time. This comprehensive presentation template includes a range of graphs, charts, and tables designed to help you visualize profitability trends with ease.
With this PowerPoint presentation, you can easily track key performance indicators, identify patterns, and make informed decisions based on your financial data. Whether you are presenting to stakeholders, investors, or internal teams, this template will help you communicate complex financial information in a clear and visually appealing way.
Features of the Visualizing Profitability Trends PowerPoint Presentation include:
– Fully editable charts and graphs: Easily customize the data points, colors, and labels to suit your specific needs.
– Multiple layout options: Choose from a variety of slide layouts to create a professional and cohesive presentation.
– Data-driven design: Simply input your financial data into the template, and the charts and graphs will automatically update.
– Easy to use: No advanced design skills are required to use this template – simply add your data and start visualizing profitability trends.
Overall, the Visualizing Profitability Trends PowerPoint Presentation is a valuable tool for any business looking to track and analyze their financial performance. With its user-friendly features and customizable design, this template will help you create impactful presentations that showcase your profitability trends in a meaningful way.


There are no reviews yet.