Description
Are you looking for a professional and modern PowerPoint presentation template to showcase stock charts and financial data? Look no further than our Stock Chart PowerPoint Presentation. This versatile template is perfect for businesses, finance professionals, and analysts who need to create compelling presentations that communicate complex data in an easy-to-understand format.
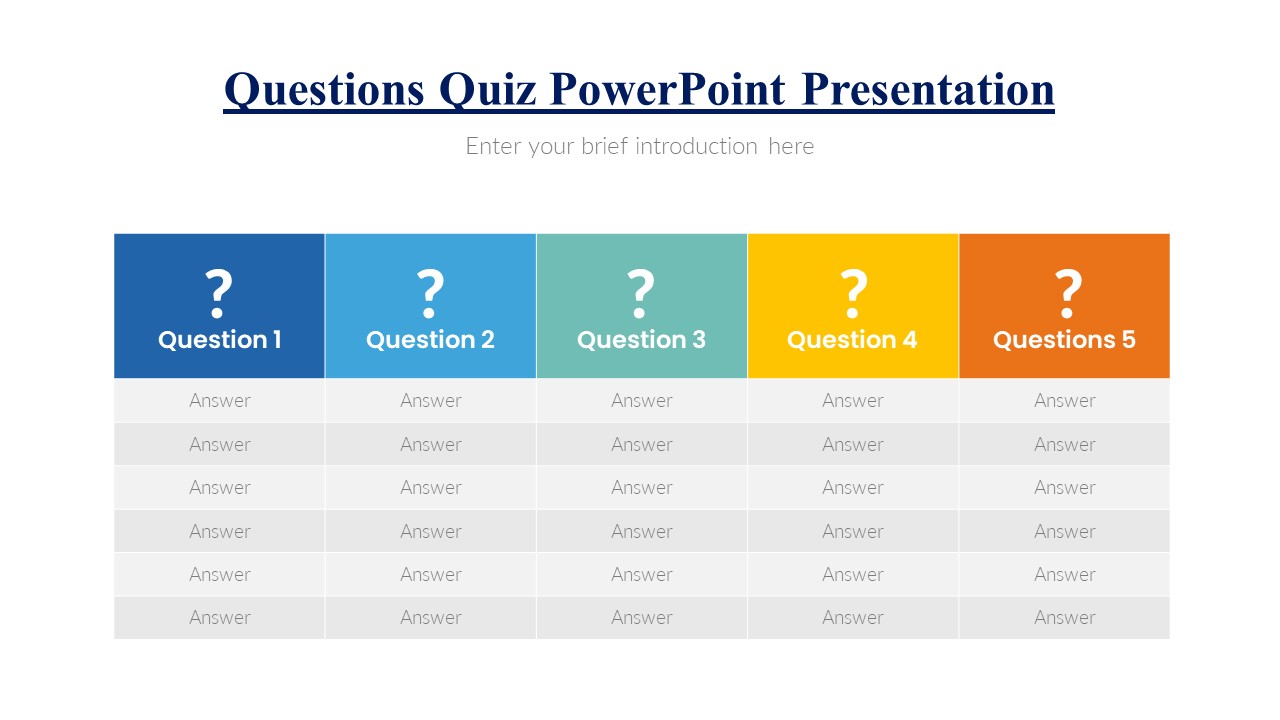
Our Stock Chart PowerPoint Presentation features a sleek and clean design that is fully customizable to suit your branding and presentation needs. The template includes a variety of slide layouts, including stock market overview slides, price charts, performance graphs, and comparison tables. Whether you need to present quarterly financial results, market trends, or investment opportunities, this template has got you covered.
With our Stock Chart PowerPoint Presentation, you can easily input your data and modify the charts and graphs to reflect the information you want to convey. The template is fully editable, allowing you to change colors, fonts, and layout to create a professional and unique presentation that will impress your audience. You can also add images, icons, and infographics to enhance your slides and make your data more visually appealing.
In addition to its customizable features, our Stock Chart PowerPoint Presentation is user-friendly and compatible with both Windows and Mac operating systems. Whether you are an experienced PowerPoint user or a beginner, you will find this template easy to navigate and work with. Say goodbye to boring and static presentations and step up your finance game with our dynamic and engaging Stock Chart PowerPoint Presentation.


There are no reviews yet.