Description
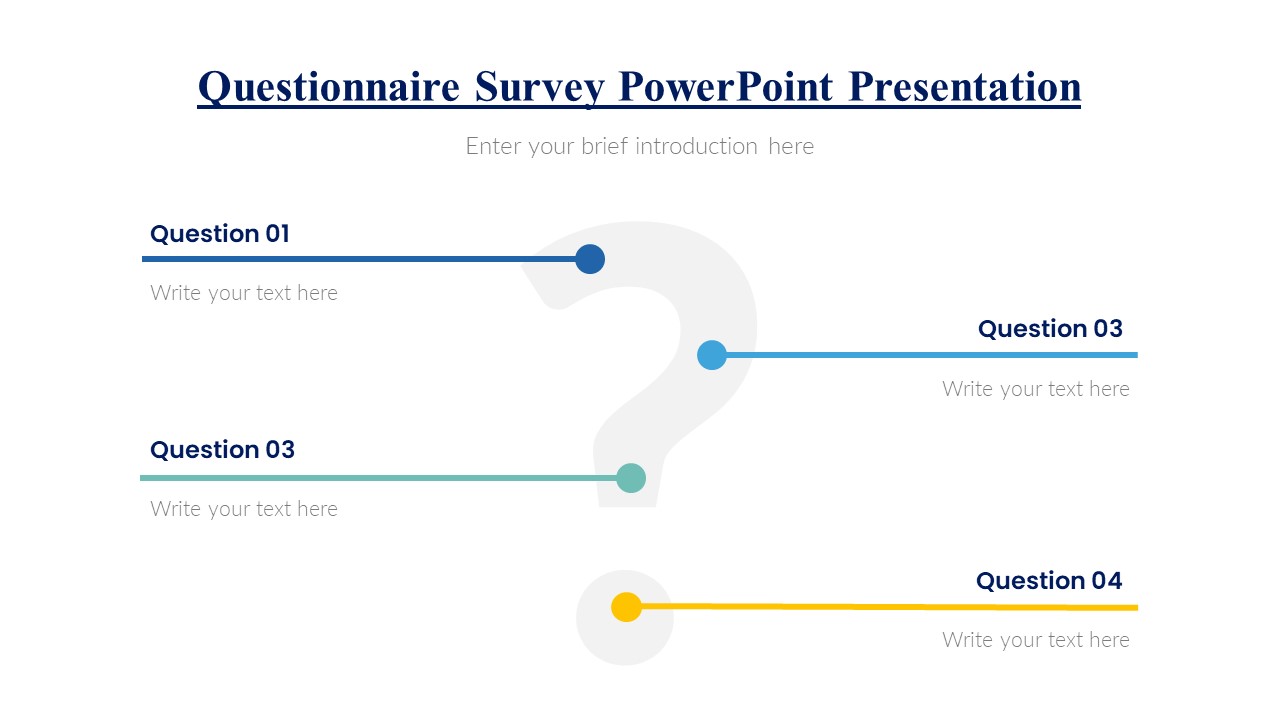
Looking to elevate your presentations with visually appealing charts and graphs? Our Ppt Charts And Graphs template is the perfect solution for all your creative data visualization needs. This template includes a wide variety of charts and graphs, such as bar graphs, pie charts, line graphs, and more, all designed to help you present your information in a clear and engaging way.
With this template, you can easily customize each chart and graph to match your branding and messaging. Whether you’re presenting sales figures, market trends, or survey results, our Ppt Charts And Graphs template will help you communicate your data effectively and impress your audience.
Key features of our Ppt Charts And Graphs template include:
1. Fully editable templates: Easily customize the colors, fonts, and data points of each chart and graph to suit your specific needs.
2. Variety of chart types: Choose from a wide range of chart types, including bar graphs, pie charts, line graphs, and more, to find the perfect match for your data.
3. Easy to use: Our templates are designed to be user-friendly, making it simple for anyone to create professional-looking charts and graphs for their presentations.
4. High-quality visuals: Each chart and graph in this template is designed with high-quality graphics and attention to detail, ensuring that your data is presented in a visually appealing way.
Overall, our Ppt Charts And Graphs template is a must-have tool for anyone looking to create dynamic and engaging presentations that make an impact. Elevate your data visualization game with this versatile and easy-to-use template today.





There are no reviews yet.