Description
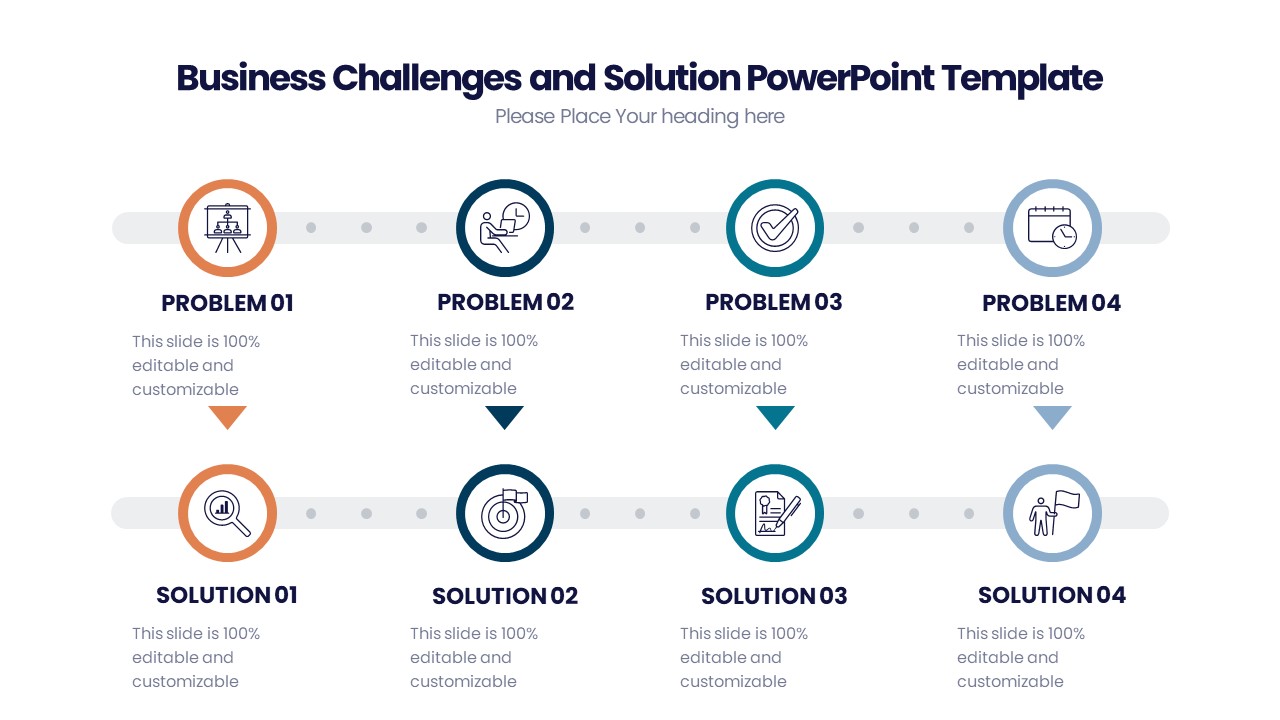
Indicators are essential tools in business and project management to visually represent data and progress. Our Indicators PowerPoint Presentation offers a range of professionally designed slides to help you effectively communicate key information.
With a modern and sleek design, this presentation template includes a variety of indicator styles such as progress bars, pie charts, dashboards, and more. These visual aids can be customized to match your branding and showcase your data in a clear and engaging way.
The slides are easy to edit and fully customizable, allowing you to adjust colors, fonts, and sizes to fit your specific needs. Whether you are presenting sales performance, project milestones, KPIs, or any other data-driven information, this PowerPoint template will help you create impactful and memorable presentations.
Key Features:
1. Fully editable templates: Easily customize colors, fonts, and sizes to match your branding.
2. Variety of indicator styles: Choose from progress bars, pie charts, dashboards, and more to visualize your data effectively.
3. Modern and sleek design: Present your information in a professional and engaging manner.
4. Easy to use: Simply drag and drop your data into the slides and edit as needed.
5. Versatile: Suitable for a wide range of industries and presentation purposes.
Enhance your presentations and make a lasting impression with our Indicators PowerPoint Presentation. Whether you are a business professional, educator, or student, this template will help you create visually stunning and informative slides that will captivate your audience.


There are no reviews yet.