

Description
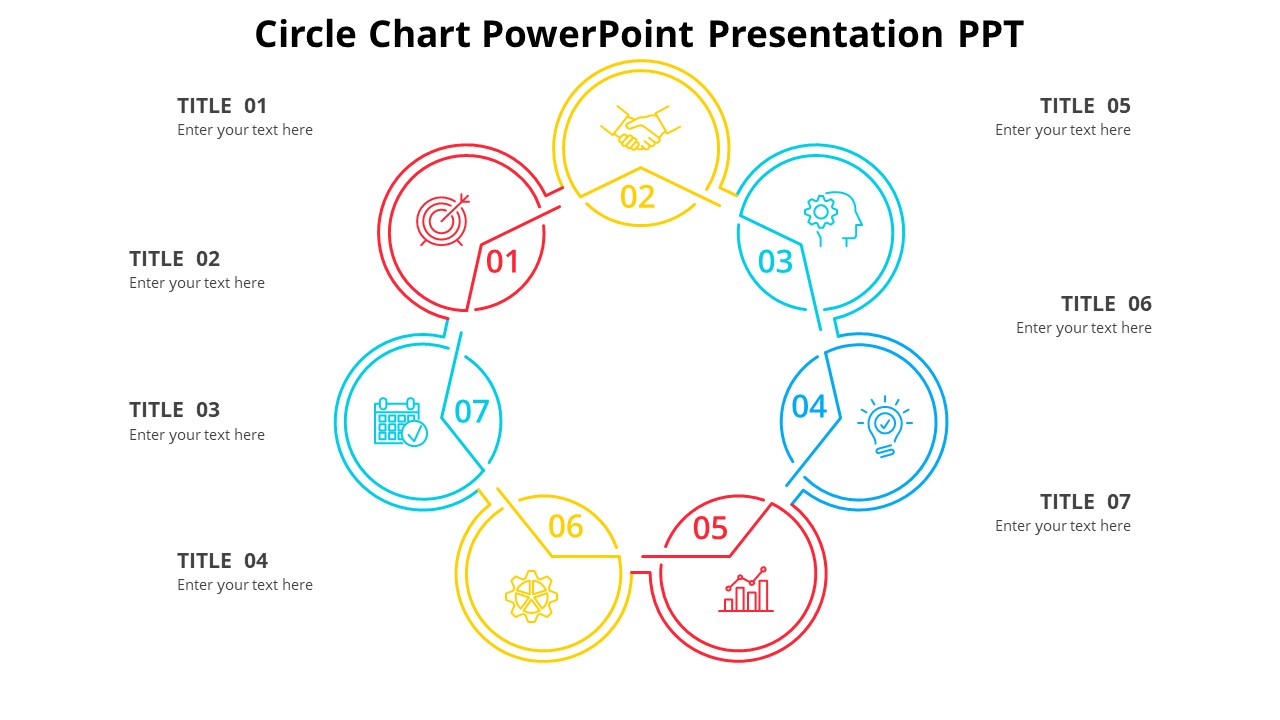
The Circle Chart PowerPoint Presentation PPT is a versatile and efficient tool for creating dynamic and visually appealing charts and diagrams. With its user-friendly interface and comprehensive features, this presentation template is perfect for professionals, educators, and students who need to showcase data in a clear and engaging way.
The Circle Chart PowerPoint Presentation PPT includes a wide range of pre-designed slide layouts that can be easily customized to suit your specific needs. Whether you’re looking to create a pie chart, doughnut chart, or circle diagram, this template has everything you need to make your data stand out.
With its fully editable templates, you can easily change the colors, fonts, and sizes of the charts to match your brand or personal style. You can also add text boxes, images, and icons to further enhance your presentation and make it more engaging for your audience.
One of the key features of the Circle Chart PowerPoint Presentation PPT is its compatibility with Microsoft PowerPoint, Google Slides, and Apple Keynote. This ensures that you can create and edit your presentations across different devices and platforms without any hassle.
In addition, the template is designed to be fully responsive, meaning that your charts will look great on any screen size or resolution. Whether you’re presenting on a computer, tablet, or smartphone, you can rest assured that your charts will be displayed accurately and professionally.
Overall, the Circle Chart PowerPoint Presentation PPT is a powerful and intuitive tool for creating eye-catching charts and diagrams. With its fully editable templates and user-friendly interface, you can easily convey your data in a clear and compelling way, making your presentations more impactful and memorable.


There are no reviews yet.