Description
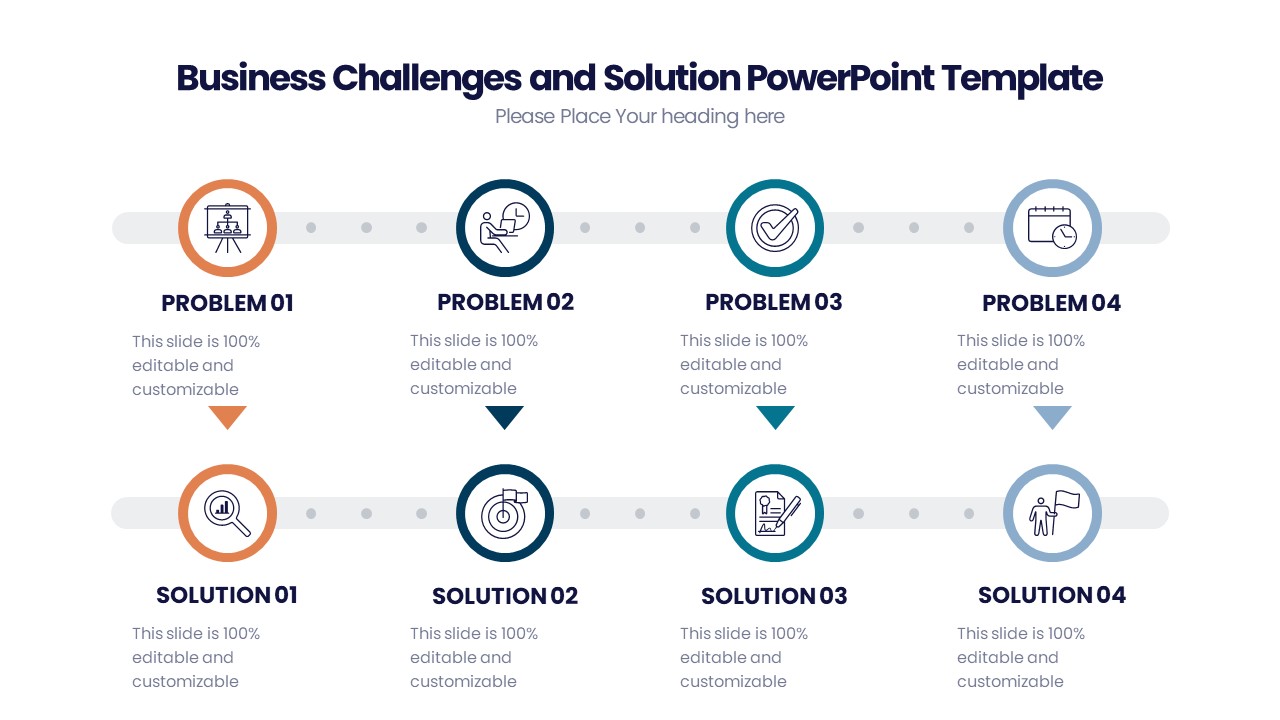
Enhance your presentations with the professionally designed Charts and Graphics PowerPoint Presentation PPT. This comprehensive template includes a variety of visually appealing charts and graphics that are perfect for showcasing data and information in a clear and engaging way.
The Charts and Graphics PowerPoint Presentation PPT features a wide range of chart types, including bar graphs, pie charts, line graphs, and more. Each chart is fully customizable, allowing you to easily change colors, fonts, and data to suit your specific needs. Additionally, the template includes a selection of high-quality graphics and icons that can be used to enhance your slides and make your presentation stand out.
Whether you are presenting sales figures, market research data, or project timelines, the Charts and Graphics PowerPoint Presentation PPT is the perfect tool for creating dynamic and visually appealing slides. Impress your audience with professional-looking charts and graphics that effectively communicate your message and help you achieve your presentation goals.
Features:
1. Fully Editable Templates: Easily customize the charts and graphics to match your brand colors and style.
2. Variety of Chart Types: Choose from a wide range of chart types to suit your specific data visualization needs.
3. High-Quality Graphics: Enhance your slides with high-quality graphics and icons that add visual interest.
4. Easy to Use: Simply insert your data and content into the templates to create professional-looking presentations in minutes.
5. Versatile: Suitable for a wide range of presentation topics, from business reports to academic presentations.
Upgrade your presentations with the Charts and Graphics PowerPoint Presentation PPT and take your slides to the next level. Impress your audience and make a lasting impact with visually appealing charts and graphics that tell a compelling story.




There are no reviews yet.